 |
|
||||||||||

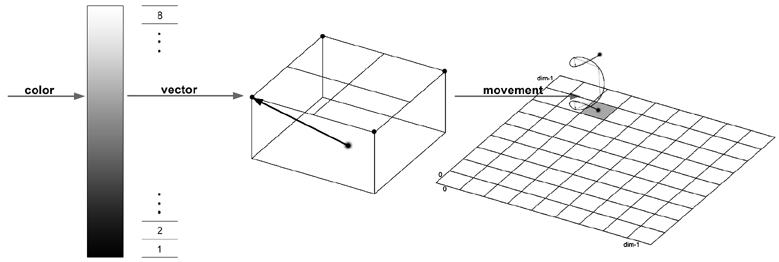
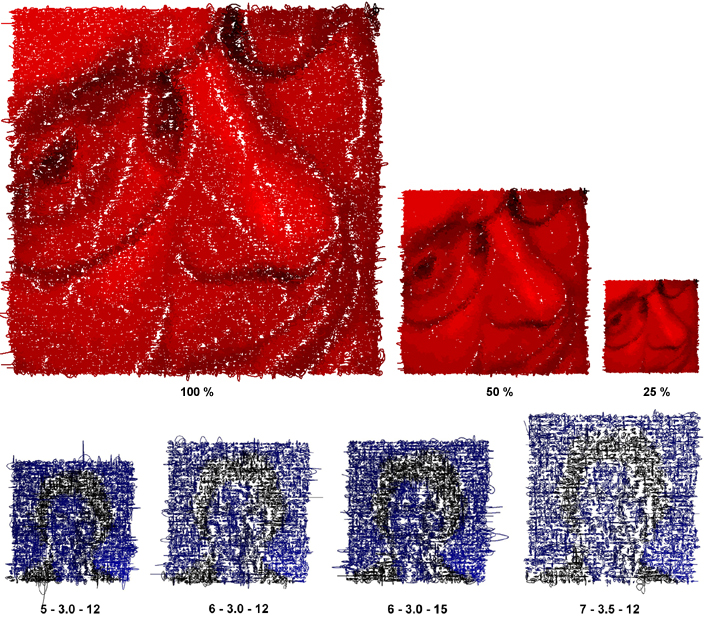
| MAS ETH ARCH/CAAD - 2005/06 - STUDENT PAGES Master of Advanced Studies in Architecture, Specialization in Computer Aided Architectural Design | 065-0005/6 Supervision: Prof. Dr. Ludger Hovestadt, Philipp Schaerer Chair of CAAD, ETH Zurich Toni Kotnik Module 2: Translating|Assignment processing of pictures Die geometrische Linie ist ein unsichtbares Wesen. Sie ist die Spur des sich bewegenden Punktes, also sein Erzeugnis. Sie ist aus der Bewegung entstanden - und zwar durch Vernichtung der höchsten in sich geschlossenen Ruhe des Punktes. Hier wird der Sprung aus dem Statischen in das Dynamische gemacht. Kandinsky's Gambit The above definition of a line given by Kandinsky in his famous study at the Bauhaus Punkt und Linie zu Fläche describes the basic idea behind the following process of translation of a picture into a line drawing. The original bitmap was first scanned and the resulting grid of averaged gray scale values were written into a XML-file. This file was then used as input data for a vectorscript that translated every value into a vector by dividing up the range of gray scales and assigning the resulting eight zones to the four different corners of a cube. The vector was then rotated at 90 degrees several times and added to itself thereby describing the control points of a spiraling NURBS in space: a geometrische Linie as the trajectory of a colored point in motion.  In order to avoid a well-ordered static expression every control point was slightly moved out of place by a small randomly produced disturbance, a derangment that adds up with the length of the produced trajectory. This is one of the paramters that has an influence on the quality of the resulting drawing. In addition, the dimension of the grid, its mesh width, and the diameter of the spiral have a strong impact on the level of disassociation of the primary picture. All of this paramters are listed in the script as constants and can be controlled easily therefore (compare blue series below for impact of width of grid - diameter of spiral - length of spiral on a the input data of a 40x40-grid). Besides this programmable paramters the distance between picture and viewer has a strong impact on the quality as demonstrated in the red series by zooming out. 
PROCEDURE KandinskysGambit;

CONST
   dim = 120;      (* dimesion of grid *)
   scale = 4;      (* width of mesh *)
   diameter = 3.5; (* diameter of spiral *)
   length = 8;     (* length of spiral *)

VAR
   currentCell:HANDLE; (* variables for parsing of input data *)
   _tag,_data:STRING;
     _flag,id:INTEGER;
   x,y,value:REAL;
   _fileName:STRING;

   z : ARRAY[0..dim-1,0..dim-1] OF REAL;  (* variables for line drawing *)
   sequence : ARRAY[0..length] OF VECTOR;
   h : HANDLE;
   u,v,i : INTEGER;


   (* --- read data from xml-file --- *)

   PROCEDURE readData(VAR _dData,_dTag:STRING; VAR _OCFlag:INTEGER);

   VAR
      _rString:STRING;
      _rChar:CHAR;
      _f1:INTEGER;

   BEGIN
      _f1:=0;
      _OCFlag:=0;
      _dData:='';
      _rString:='';
      _dTag:='';
      WHILE ((_f1=0) AND (NOT EOF(_fileName))) DO
         BEGIN
            Read(_rChar);
            IF _rChar='/'
               THEN BEGIN
                     IF _OCFlag=1 THEN _OCFlag:=2;
                     _rString:='';
                    END
               ELSE BEGIN
                     IF _rChar='<'
                        THEN BEGIN
                              _OCFLag:=1;
                              _dData:=_rString;
                              _rString:='';
                             END
                        ELSE BEGIN
                              IF _rChar='>'
                                 THEN BEGIN
                                       _dTag:=_rString;
                                       _f1:=1;
                                      END
                                 ELSE BEGIN
                                       _rString:=Concat(_rString,_rChar);
                                      END;
                             END;
                    END;
         END;
      IF EOF(_fileName) THEN _dTag:='xx';
   END;


   (* --- initialize array --- *)

   PROCEDURE Init(VAR DataFile:ARRAY[0..dim-1,0..dim-1] OF REAL);

   VAR
      temp : ARRAY[0..dim-1,0..dim-1] OF REAL;
      u,v : LONGINT;

   BEGIN
      GetFile(_fileName);
      Open(_fileName);
      WHILE _tag<>'xx' DO
         BEGIN
            readData(_data,_tag,_flag);
            IF (_flag=2)
               THEN BEGIN
                     IF _tag='CELL'
                        THEN BEGIN
                              temp[u,v]:=value;
                              Message('Init: ',u,' ',v,' : ',value);
                             END;
                     IF _tag='VALUE' THEN value := Str2Num(_data);
                     IF _tag='X' THEN u := Trunc(Str2Num(_data));
                     IF _tag='Y' THEN v := Trunc(Str2Num(_data));
                      END;
         END;
      Close(_fileName);
      _tag:=' ';
      DataFile:=temp;
   END;


   (* --- calculate next point of sequence --- *)

   FUNCTION DirectTo(value:REAL):VECTOR;

   VAR
      direction : VECTOR;
      gridpoint : INTEGER;

   BEGIN
      gridpoint:=1;
      WHILE value > gridpoint/8 DO gridpoint:=gridpoint+1; (* calculate zone of gray scale ... *)
      CASE gridpoint OF                                    (* ... and assign corner of grid *)
         1,3,5,7 : direction.x:=-1*diameter;
         2,4,6,8 : direction.x:=1*diameter;
      END;
      CASE gridpoint OF
         1,2,5,6 : direction.y:=1*diameter;
         3,4,7,8 : direction.y:=-1*diameter;
      END;
      direction.z:=0;
      DirectTo:=direction;
   END;


   (* --- generate curl --- *)

   PROCEDURE GenerateHair(u,v:INTEGER);

   VAR
      dposition : VECTOR;
      i,ui,vi : INTEGER;
      h1,h2,h3 : HANDLE;
      x,y : INTEGER;


   BEGIN
      PenFore(65535*z[u,v],0,0); (* set color using only red chanel *)
      sequence[0].x:=u*scale;    (* point on grid as starting point *)
      sequence[0].y:=-v*scale;
      sequence[0].z:=0;
      dposition:=DirectTo(z[u,v]);
      FOR i:=1 TO length DO
         BEGIN
            dposition.x:=(-1)^i*dposition.x*(0.5+random);     (* rotate vector ... *)
            dposition.y:=(-1)^(i+1)*dposition.y*(0.5+random);
            dposition.z:=0;
            sequence[i]:=sequence[i-1]+dposition;             (* ... and describe new control point *)
         END;
      h1:=CreateNurbsCurve(sequence[0].x,sequence[0].y,sequence[0].z,TRUE,2);
      FOR i:=1 TO length DO AddVertex3D(h1,sequence[i].x,sequence[i].y,sequence[i].z);
      DSelectAll;
   END;


(* --- main program --- *)
BEGIN
   FillPat(0);
   init(z);
   FOR v:=0 TO dim-1 DO
      FOR u:=0 TO dim-1 DO
         BEGIN
            Message('GenerateHair: ',u,'  ',v);
            GenerateHair(u,v);
         END;
END;
RUN(KandinskysGambit);
In a variation of the above process the trajectories were defined by adding up the constructed vectors of the points in one single row and combining them into a eckige Linie. This way, every vertex marks a change in the associated color zone, i.e. a perceptible shift in the color value of the primary bitmap. Thus, the activity in the resulting drawing can be seen as a rough measurement for the differences in colors in the original pictures. 
PROCEDURE LinearKandinsky;

CONST
   dim = 40;
   scale = 3;
   linethickness = 24;

VAR
   currentCell:HANDLE;
   _tag,_data:STRING;
     _flag,id:INTEGER;
   x,y,value:REAL;
   _fileName:STRING;

   z : ARRAY[0..dim-1,0..dim-1] OF REAL;
   colorvalue : ARRAY[1..8] OF INTEGER;
   u,v,i : INTEGER;


   (* --- read data from xml-file --- *)

   PROCEDURE readData(VAR _dData,_dTag:STRING; VAR _OCFlag:INTEGER);

   VAR
      _rString:STRING;
      _rChar:CHAR;
      _f1:INTEGER;

   BEGIN
      _f1:=0;
      _OCFlag:=0;
      _dData:='';
      _rString:='';
      _dTag:='';
      WHILE ((_f1=0) AND (NOT EOF(_fileName))) DO
         BEGIN
            Read(_rChar);
            IF _rChar='/'
               THEN BEGIN
                     IF _OCFlag=1 THEN _OCFlag:=2;
                     _rString:='';
                    END
               ELSE BEGIN
                     IF _rChar='<'
                        THEN BEGIN
                              _OCFLag:=1;
                              _dData:=_rString;
                              _rString:='';
                             END
                        ELSE BEGIN
                              IF _rChar='>'
                                 THEN BEGIN
                                       _dTag:=_rString;
                                       _f1:=1;
                                      END
                                 ELSE BEGIN
                                       _rString:=Concat(_rString,_rChar);
                                      END;
                             END;
                    END;
         END;
      IF EOF(_fileName) THEN _dTag:='xx';
   END;


   (* --- initialize array --- *)

   PROCEDURE Init(VAR DataFile:ARRAY[0..dim-1,0..dim-1] OF REAL);

   VAR
      temp : ARRAY[0..dim-1,0..dim-1] OF REAL;
      u,v : LONGINT;
      pointer : INTEGER;

   BEGIN
      GetFile(_fileName);
      Open(_fileName);
      WHILE _tag<>'xx' DO
         BEGIN
            readData(_data,_tag,_flag);
            IF (_flag=2)
               THEN BEGIN
                     IF _tag='CELL'
                        THEN BEGIN
                              temp[u,v]:=value;
                              Message('Init: ',u,' ',v,' : ',value);
                             END;
                     IF _tag='VALUE' THEN BEGIN
                                          value := Str2Num(_data);
                                          pointer:=1;
                                          WHILE value > pointer/8 DO pointer:=pointer+1;
                                          colorvalue[pointer]:=colorvalue[pointer]+1;
                                        END;
                     IF _tag='X' THEN u := Trunc(Str2Num(_data));
                     IF _tag='Y' THEN v := Trunc(Str2Num(_data));
                      END;
         END;
      Close(_fileName);
      _tag:=' ';
      DataFile:=temp;
   END;


   (* --- calculate next point of sequence --- *)

   FUNCTION DirectTo(value:REAL):POINT;

   VAR
      direction : POINT;
      gridpoint,colorscale : INTEGER;

   BEGIN
      gridpoint:=1;
      WHILE value > gridpoint/8 DO gridpoint:=gridpoint+1;
      colorscale:=colorvalue[gridpoint]/dim;
      CASE gridpoint OF
         1,3,5,7 : direction.x:=-1*scale*colorscale;
         2,4,6,8 : direction.x:=1*scale*colorscale;
      END;
      CASE gridpoint OF
         1,2,5,6 : direction.y:=1*scale*colorscale;
         3,4,7,8 : direction.y:=-1*scale*colorscale;
      END;
      DirectTo:=direction;
   END;


   (* --- generate path --- *)

   PROCEDURE GenerateLine(u:INTEGER);

   VAR
      position,dposition : POINT;
      sequence : ARRAY[0..dim] OF POINT;
      sv,si : INTEGER;
      h : HANDLE;

   BEGIN
      PenFore(trunc(65535*u/dim),0,0);
      MoveTo(0,scale*u);
      FOR sv:=1 TO dim DO
         BEGIN
            dposition:=DirectTo(z[u,sv-1]);
            Line(dposition.x,dposition.y);
         END;
   END;


(* --- main program --- *)
BEGIN
   FillPat(0);
   PenSize(linethickness);
   FOR i:=1 TO 8 DO colorvalue[i]:=0;
   init(z);
   FOR u:=0 TO dim-1 DO
      BEGIN
         Message('GenerateLine: ',u);
         GenerateLine(u);
      END;
   DSelectAll;
END;
RUN(LinearKandinsky);
| ||||
This website has been archived and is no longer maintained.
